Custom Marketing Analytics Now Included on All Media Projects
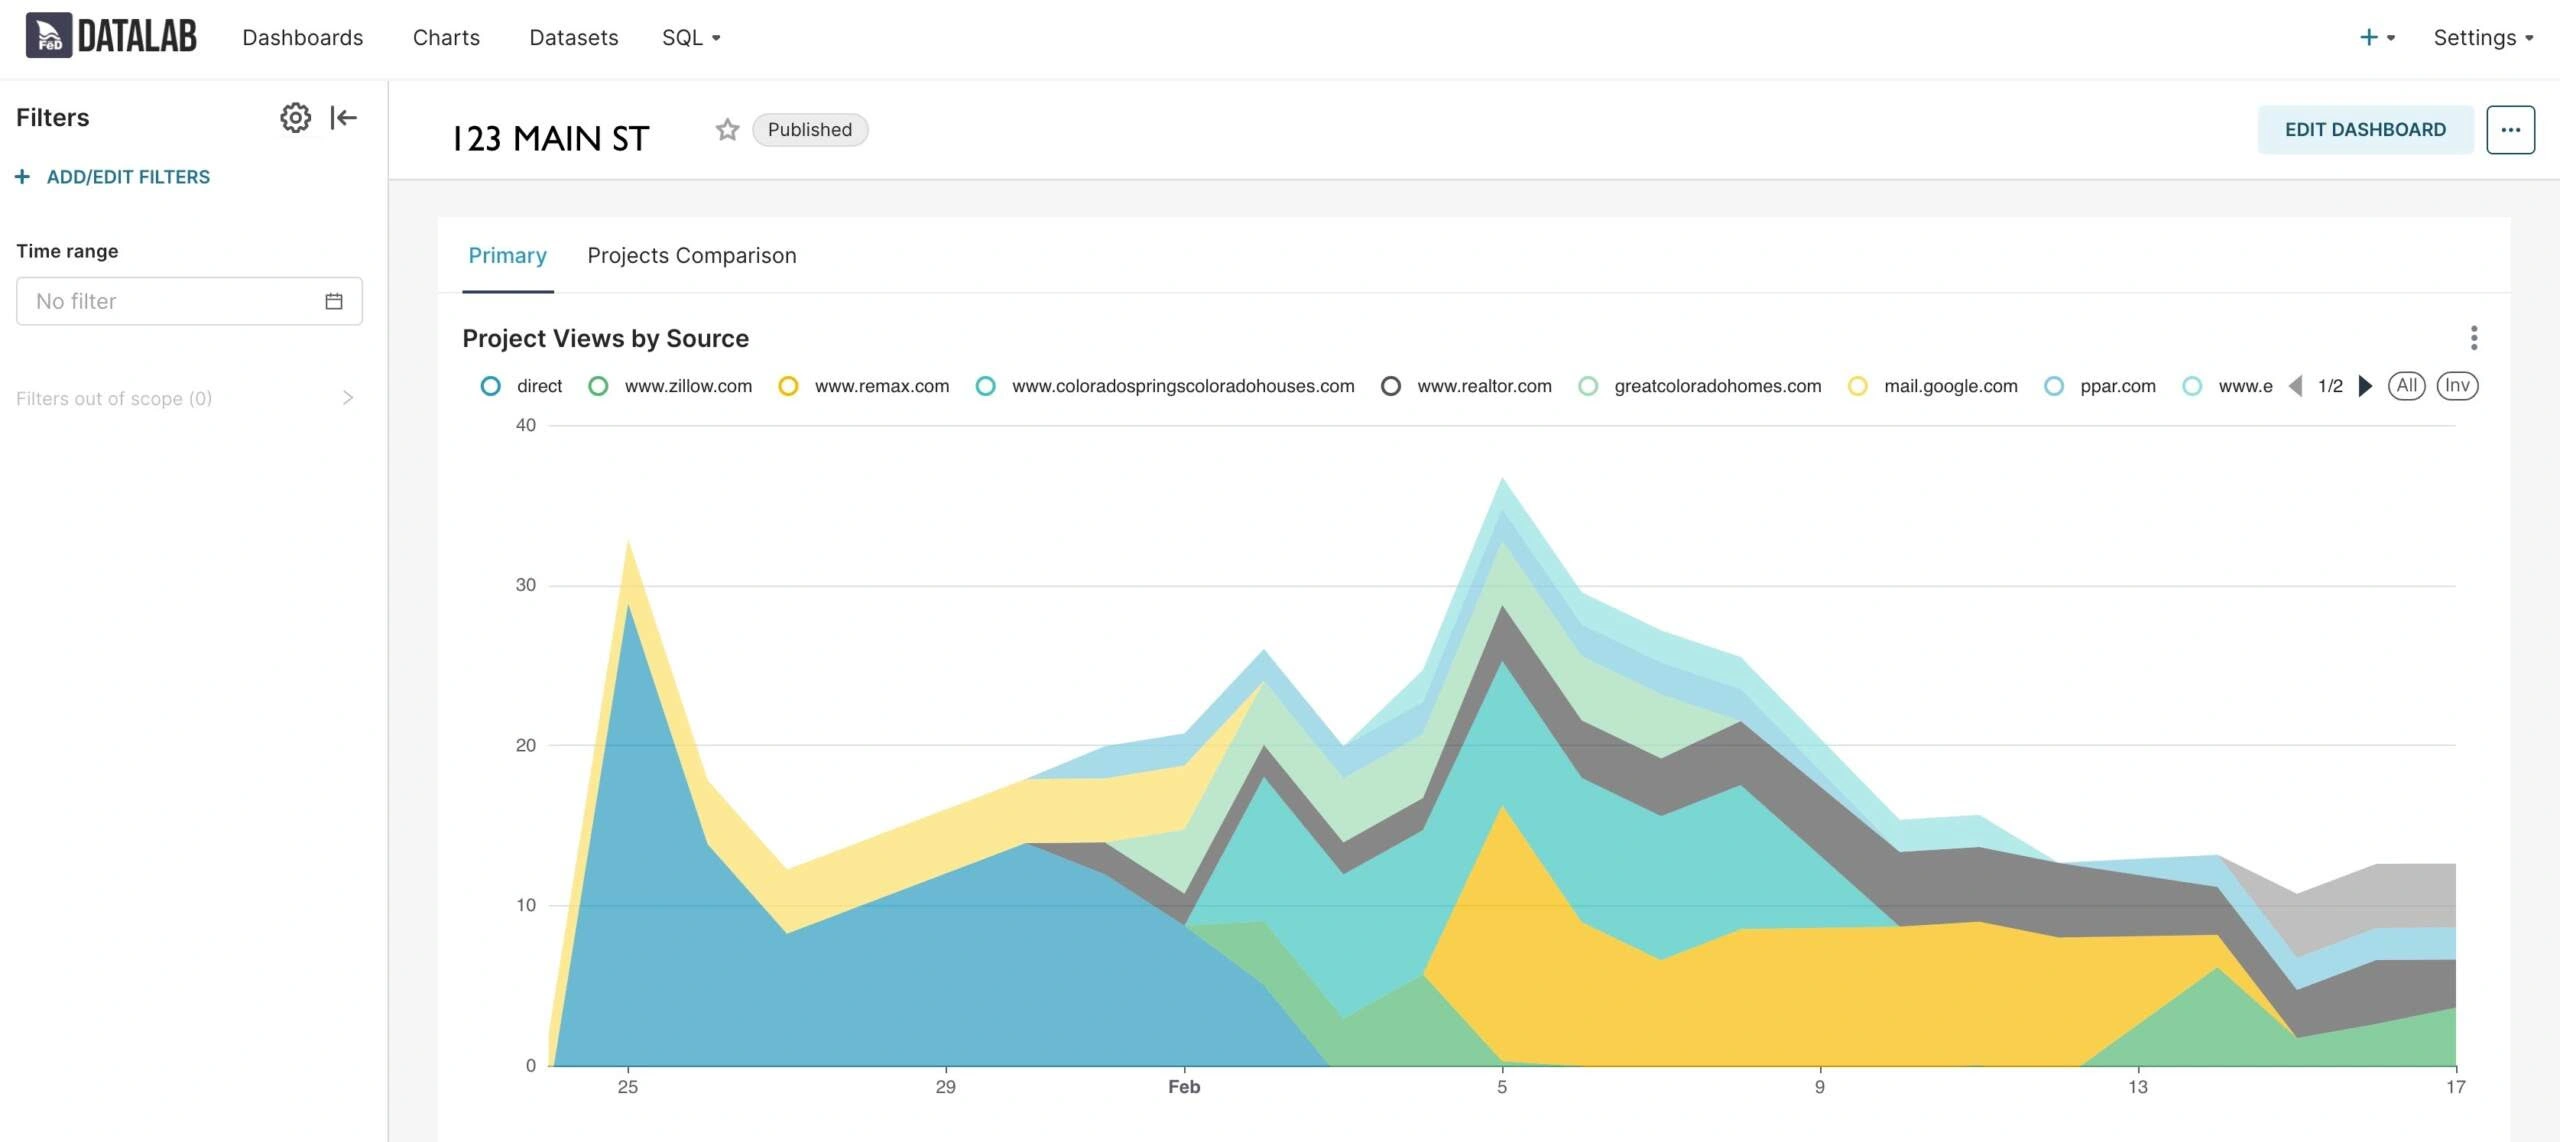
We’re EXCITED to announce the release of Datalab — our custom data and analytics solution, available for free to all digital media clients, on all digital media projects! Datalab is a powerful tool to help you analyze how well your media projects are performing — providing poignant, near real-time information on where your audience is coming from, what they’re looking at, from which devices and from what parts of the country. Datalab is a platform where advanced data dashboards will be generated and accessible, on all of your media projects with us.
What does this mean for you? With Datalab, you’ll be able to …
- Instantly see how well your project is performing
- Identify where people are accessing your media from, digitally and geographically
- Identify important trends associated with marketing campaigns
- Compare your project’s performance with our average
- Compare this project’s performance with other projects of yours
- Export PDF versions of the project dashboard for presentation to your clients
- Modify the date range filter (in the sidebar to the left of the main dashboard) to view certain, custom time periods
- Use Datalab to WIN listings — let your clients know that you’re using the best, most advanced and professional data and analytics tools to market their listing as effectively as you can!

If you’ve ever used Google Analytics, the data here and the presentation will feel familiar. Datalab, however, is built on top of our own database — there’s no Google here — just your data, accessible only to you, residing on our private servers. We believe strongly in data ownership and in independent solutions that circumvent large web monopolies wherever possible. Datalab is one of these independent solutions, enabling you to make the best, most informed marketing decisions for your project — bringing additional expertise and value to your clients.
Starting today, Datalab dashboards will be generated on all media projects making use of our Single Project Pages (SPPs). When you order media from us, these Datalab dashboards will be generated automatically. If you’re new to the system, user credentials will be generated and you’ll receive those in a separate email. Once you’re in the system, you’ll be presented with a home-page showing all of your available project dashboards. We won’t be generating dashboards on past projects completed before today — unless you ask us to. If you have a past project that you’ve been using our SPPs to advertise, and would like to look at your performance data, shoot us an email and we’ll get your dashboard generated.
One thing to keep in mind — Datalab’s data is sourced from our Single Property Pages (SPPs). To collect the most data, be sure to use the relevant SPP link in your digital advertising — in email blasts, social media posts, in other websites, or in the MLS/Zillow as a “virtual tour.” We designed these SPPs to be powerful, versatile presentations of your media, for this purpose!
Let us know if you have any questions! If you’ve been issued credentials already, login here:
FAQ
If your dashboard is new, or you haven’t yet started advertising your project using your Single Property Page (SPP), there won’t be enough data to create a visualization (chart). Start advertising, use the SPP URL within the MLS listing, on Zillow, etc, and check back in a couple days!
All of them! Datalab dashboards might not be generated if your project most likely won’t be utilizing our SPPs to distribute media (if the property is a short term rental listing, for instance, and you’re just listing this on Airbnb). But by default, dashboards are available on everything. If you don’t see a dashboard link in your media delivery and want one, just ask! Datalab dashboards are available without additional charge on every media project you purchase with us.
Use your project’s SPP link anywhere online where you want people to see your media. SPPs are fast, easy and mobile-friendly and are the best way to quickly share your media or advertise your project. We designed them for this purpose. Use the SPP link on social media, or in other advertising. Display the link on your own website. For real estate listings, use the link whenever your MLS or listing site (Zillow) asks for a “virtual tour”.
At this point, customization for individual projects is limited. We designed the standard dashboard to include the most widely relevant data and data visualizations, though, and we think that they provide valuable insights into most media projects.
YES. On the left sidebar, open the “filter” menu identified by the three lines in the form of a triangle. You can then enter a date range, and your dashboard will refresh, visualizing that range’s data.
At this point, no, though this is a future goal. You’d just have to add our custom tracking code to your source (i.e. your own website). We’ll keep folks posted about features like this in the future.
Probably not, unless the person you’re sharing these with is a close associate. The performance of your custom project should be confidential. If you’d like to share your dashboard with a client or another stakeholder, we recommend exporting a PDF version of the dashboard.
In order to smooth out the visualization of the data, some of the charts display average values (rolling averages over 7 days, for instance). Without this averaging, some of the charts would be pretty chaotic looking, making it hard to identify trends.